We can't find the internet
Attempting to reconnect
Something went wrong!
Hang in there while we get back on track

Dear Investors:
In C1Q23, Minerva India Under-served was down -5.6% (net; in INR terms), vs. -6.8% decline in BSE Smallcap and -5.9% decline in BSE 500. Over 12 years of deployment in institutionally under-owned/orphaned part of listed India, Minerva India Under-served is up +17.2% annualized (net; in INR terms), vs. +9.8% annualized gains (gross; in INR terms) in BSE 500 and BSE Smallcap. Importantly, this decade-plus alpha wasn’t driven by skewed asset-class driven prints in 2014, 2017, or 2021. Since-inception annualized volatility for Minerva India Under-served has been 21.3%, vs. 17.4% for BSE 500 and 23.3% for BSE Smallcap. For a strategy that has always remained largely camped within the smaller end of India’s small cap space, our volatility has remained materially below that of smallcaps, despite our significantly smaller size exposures. To better appreciate underlying idiosyncrasies, and our superior risk-adjusted attributes across holding periods and index of your choice, please click here.
Regardless of where one’s dart landed while picking timeframes over the past decade, India’s relative earnings trajectory was undeniably unremarkable, with little to choose between MSCI India and MSCI EM. In the prior decade however (2002-2012), underlying earnings for MSCI India had materially outpaced that of MSCI EM. Today though, with lower growth differentials and lower below-the-line leverage, we remain thoroughly unconvinced of any narrative that the street picks to justify MSCI India‘s current premium (that too on stretched growth expectations1 ) over MSCI EM (ex-India). That’s not to suggest that MSCI India doesn’t deserve one, but we would be uncomfortable with anything materially over 50%.
In an otherwise stretched India, we own mispriced idiosyncrasies at compelling valuations. Minerva India Under-served (ex-financials) ended March 2023 trading at 6.6x F2023E (Mar) EBITDA, or about 60% discount vs. Nifty50 and NiftySmallcap50. That’s also about a mid-30s discount vs. this book’s own pre-pandemic average, even as headline names still trade a bit ahead of pre-pandemic averages [and they would be trading at even higher premiums if F2024E (Mar) estimates for these headline names weren’t as sanguine]. Critically, our valuations aren’t based off of optimistic growth expectations, even as street’s estimates clearly are. Our expectations (ex-financials) are built off of high-teens earnings growth in F2024E (vs. mid-20s over the last decade), vs. >20% for Nifty50 (ex-financials), which implies a near doubling from low double-digit growth of the last decade. Our alpha capture of 12+ years is planked upon sustainable and superior earnings, as opposed to multiple expansion largesse. We remain extremely confident that in F2024E (Mar) our holdings will again create incremental value, which is mostly unpriced in our view.
Within India’s headline names, ‘outright delusion’ is gradually giving way to ‘optimism’, which is getting capitalized at undeniably stretched valuations. While growth expectations have been revised into arguably reasonable territory (still not pricing uncertainties though), Indian headline valuations2 (see Exhibit 1 on next page) still do not offer the comfort we see elsewhere. While we believe that Indian revenue estimates (vs. what we see elsewhere) don’t appear relatively stretched at this time, in-built margin expansion hopes certainly appear relatively stretched. To draw some context here, consider the following → Ex-Materials, Energy, and all services3 , median EBITDA growth for benchmark manufacturing4 names across emerging Asia peers is expected to lead median revenue growth by 3-4% in 2023. The comparable increase for Nifty50

1 >20% estimated earnings growth (ex-financials) for F2024E (Mar)
2 Nifty50’s headline valuation premium in fact masquerades how rich its components truly are, since the index has nearly twice as much weight of Materials and Energy (which have lower headline multiples) vs. MSCI EM.
3 Median F2024E (Mar) EBITDA growth expectation for Nifty50’s Materials and Energy components is currently leading median revenue growth by 15%, and by 20% if one were to exclude Reliance Industries.
4 They collectively make about a third of Nifty50 (ex-financials) weight

peers currently stands close to 7%5 . In sharp contrast, Chinese EBITDA estimates for manufacturing components, despite factoring higher underlying revenue growth, is currently reflecting significantly lower margin expansion vs. Dalal Street’s estimates. We continue to struggle with street’s broad-based margin expansion narratives across Indian manufacturing industries in F2024E (Mar). We would particularly accentuate the following:
- 1. Inability to pass through costs continues to be a meaningful headwind to underlying profitability for Nifty50 manufacturing components (ex-Materials and Energy) – For the past 2 quarters, these components have comped against higher metal costs of last year, but it hadn’t quite translated into material margin expansion. Despite a mid-single digit decline in metals and ~70% yoy decline in container rates in F3Q23 (Dec), a third of these components still reported a decline in gross margins. Overall, at the operating line, this group reported flattish margins vs. F3Q22 (Dec).
- 2. If energy costs remain where they are, lower freight costs should be an incremental tailwind in F2024E (Mar). We note that by the end of C2022, container rates had retraced back to C4Q20 levels, and have since dropped to pre-pandemic levels. That said, impact of freight deflation is unlikely to be significantly more pronounced in F2024E (Mar) vs. what we already saw in F3Q24 (Dec). Since just about 15% of material procurement for these components is non-domestic, this by itself is unlikely to drive materially over 150-200 bps benefit to F2024E (Mar) margins.
- 3. Nifty50 manufacturing components (ex-Materials and Energy) have insignificant leverage below the operating line, and in the absence of significant buybacks, Indian earnings are largely tied to the operating line, leaving immaterial room for a surprise here.
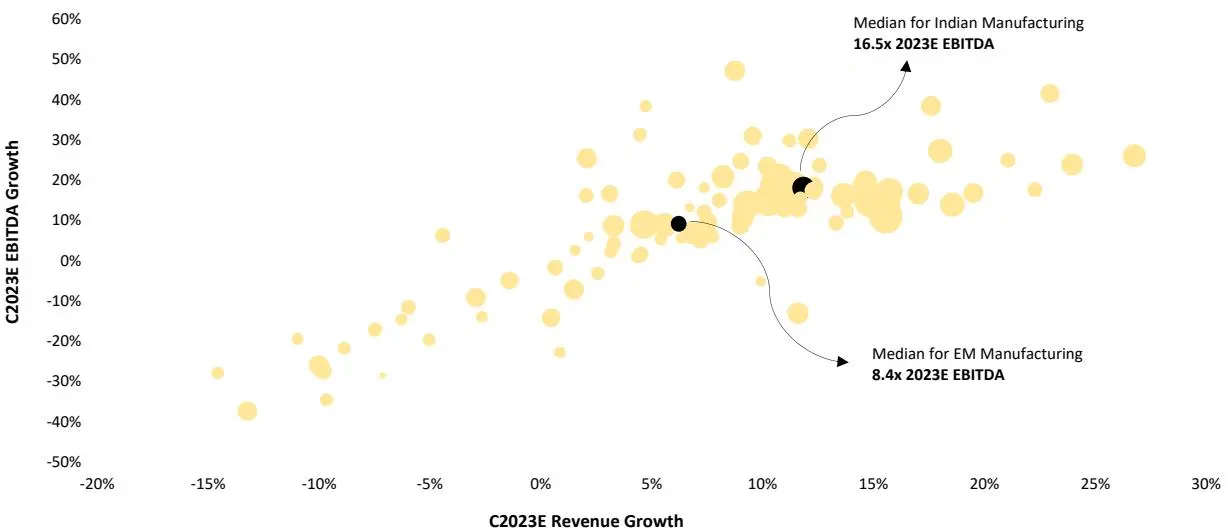
Exhibit 1 – Revenue, EBITDA, and Valuation scatterplot for headline EM Manufacturing (excluding Materials and Energy)
Notes: All estimates are as at the end of March 2023; Bubble sizes indicate EV/2023E EBITDA; Financials and outliers were excluded; We selected the following EM peers for the exercise [China, Korea, Brazil, South Africa, Taiwan, Indonesia, Mexico, Malaysia, and Thailand]; 90% of Taiwanese manufacturing components were from Technology Hardware; We classify Asian Paints as a Materials name (as per GICS), and accordingly it was not included here.
Source: S&P Global Market Intelligence; Reuters
5 Energy costs would be comping against a higher base from March 2023 onwards. While material costs have now softened in high single digits vs. same time last year, energy costs have declined in the mid-20s. Until F3Q23 (Dec), energy costs were still higher yoy.

Let’s evaluate street expectations for select manufacturing components (ex-materials and energy) in India where domestic procurement rates are high:
- Consumption at mass-market two-wheeler OEMs (Hero, Bajaj, and part of HMSI) 6 is significantly more levered vs. what one sees at say OEMs such as TVS or Yamaha. We note that in F2024E (Mar), India’s repo rate is expected to average between 6.5% and 6.75%, or 125-150 bps over F2023A’s average and should be a distinct headwind, unless India doesn’t have a spectacular monsoon (which isn’t a projection yet). Street’s current projection for 2W revenue growth in F2024E (Mar) to be in the 7-9% range certainly isn’t pricing clearly visible uncertainties such as these. Further, our checks outside Indian metros suggest muted consumption trends, and we are still unable to see any compelling rationale to side with narratives that are framed around a significant expansion in private capex. Lastly, as we write this quarter-end letter, expected 2W new launches in F2024E are expected to be about flattish, and even that is on account of significantly higher launches at HMSI. Ex-HMSI, F2024E launch numbers will likely be lower by 8-10%. Nonetheless, that doesn’t preclude street from penciling a low double-digit revenue growth for 2W OEMs in F2024E at this time, which would be comping a mid-teens unit growth in F2023 off of a depressed F2022 base. Even assuming that IMD’s ‘normal’ monsoon forecast ends up being correct, in our view these estimates aren’t effectively pricing uncertainties yet.
- Street’s F2024E (Mar) revenue growth expectations for Consumer Staples (excluding Asian Paints, which is bizarrely classified as a ‘consumer’ name in India) is currently in low double digits7 . We note however that underlying margin expansion expectations in this space don’t appear as overly stretched now as we see elsewhere in India. The larger challenge here is headline valuations. Indian headline packaged food and tobacco names today trade at >300% and >150% premiums respectively over emerging market peers, thoroughly irreconcilable with even the most buoyant expectations of near or distant growth. Valuation disconnects can be durable but are rarely everlasting, and most of these names have more than an even chance to be ‘dead money’ than just about anything we have seen in India in distant memory.
- Underlying margin expansion expectations at Indian PV OEMs also appear relatively stretched to us, and show, by far, the biggest revenue growth and margin expansion divergence vs. peers anywhere in the world. All this at a time when discretionary spends can arguably come under pressure, and OEMs already suggesting that most of commodity deflation is already captured. Further, we note that 90-95% of material procurement at Indian PVs is localized and there is limited room to benefit from lower freight costs on easy comparisons from last year. These cheerful expectations are now getting capitalized, on average, at ~9x est. EBITDA, reflecting a steep 100% premium vs. EM peers.
Meanwhile, our checks on contractual employment nationally suggest no acceleration in employment, with relative strength in automotive hiring and relative weakness in construction hiring. Be it on earnings expectations or valuations, we continue to view most of India’s headline names, nearly across the capitalization spectrum, as unattractive in both relative and absolute terms, and consequently see select opportunities in emerging Asia as significantly more compelling at this time. We firmly believe that there is more than an even chance that India’s headline names would be distinct laggards vs. emerging Asia peers (ex-Korea) over the next year.
6 Our only holding in two-wheeler auto parts had nearly zero exposure to Hero Motocorp and Bajaj Auto in F2023 (Mar)
7 Our C1Q23 checks across staples distributors suggested that downtrading is now significantly more prevalent, with ~45% of all respondents reporting downtrading

We briefly discuss select views on some of our key holdings, while also sharing thoughts on recent additions/exits:
We are now working with the thesis that LED penetration within two-wheeler lamps would reach close to 100% within next 5 years. This is a material shift from our significantly more gradual shift thesis earlier. All new two-wheeler models under development today have LED lights, with well more than half being LED-only models. For context, ~10% of all models sold in India in F2022 (Mar) were completely LED8 . We note that in mid-Feb, Yamaha India confirmed that all models in India will have full-LED indicators. Also, nearly 90% of all two-wheeler models that were refreshed over the last 12 months were either already entirely LED (prior to model refreshment) or at least partly shifted from halogen to LED. Tellingly, within model refreshments, we saw an even more pronounced trend of increased LED content at ‘mass OEMs’ such as Bajaj and Hero, with half of all models seeing increased LED content after refreshment. We conservatively expect to grab >20% annualized gains on our two-wheeler lamps holding over the next 3 years.
Alloy ramp-up at our second biggest holding is just about keeping pace with continued growth; Exports highly likely to revive on a very depressed F2023 (Mar) base. By our estimate, in the first 3 quarters of F2023E (Mar), ~70% of domestic PV wheel volume for our holding came from steel rims (accounting for ~30%9 of domestic PV revenues), suggesting about a 5-points volume mix shift to alloys within PV revenues vs. the last fiscal. That’s about in line with what we believe is an ongoing structural 5-7% mix shift towards alloy rims. As we write this investor letter, capacity at our holding’s alloy facility is set to expand by a million wheels (>30% increase)10. By our conservative estimate, >2.8 mil wheels were shipped from this facility in F2023 (Mar)11, suggesting near full utilization just prior to another million wheels line coming online. In F2024E (Mar), we conservatively expect 3.6-3.7 mil alloy wheels getting shipped from this facility.
Overall, even with steel rim exports not reviving (on an undeniably low base of F2023), we can comfortably still pencil in close to low double-digit EBITDA growth here, translating conservatively into mid-teens earnings growth. This name today trades at just about 6x on what we believe is a very achievable F2024E (Mar) EBITDA estimate, which is steeped in conservative interpretation of our current observations (in sharp contrast with what we see within headline names in India).
We have maintained that we would aggressively engage if broader panic were to spill over into our highest conviction holdings. Accordingly, we added a bit to our forestry position in March and raised it to our single security cap. We have consistently maintained that relative concentration, stable/growing demand, and very high domestic mill operating rates within integrated domestic forestry names preclude chances of sharp price corrections within uncoated cut-size paper grades (please refer to our January 2023 investor letter here). Our high-frequency checks continue to sync with this. We had previously communicated that we would engage aggressively if overly generalized views on forestry drive any significant selling within this holding. Accordingly, we further increased our allocation in this position in mid-March after it came off almost 15% YTD. It may or may not be a skewed value capture (which is occasionally a possibility in institutionally under-owned situations in India), but we expect to compound this holding in at least the high-
8 LED-only penetration had doubled vs. 5% in F2020 (Mar)
9 Alloy rim pricing, by our estimate, was 5-6x the pricing of steel rims
10 This is a 70-acre facility, and about half of it would be still available for further builds after the current capacity expansion
11 Our holding accounts for about a third of Indian PV alloy rim shipment to OEMs

teens over the next 3 years (under our most conservative scenarios), which should likely handily outpace Nity50’s (ex-financials) earnings growth under any scenario other than an unprecedented steroidal wild bull case for India.
2022’s original Hindi content disasters aren’t a reflection on viewership trends. Box-office was and is largely driven by quality of content, and nothing else should explain underwhelming Hindi (original language content) collections. Second half of C2022 was an undeniable disaster for Hindi content – Collectively, worldwide collections for such content barely matched overall production budgets. In sharp contrast, for every dollar of production budget, Telugu content collectively earned >$1.4 worldwide at the box office, which was better than what original Telugu content did in C2019. In fact, regardless of the language of the content, nothing did nearly as poorly as Hindi content did in 2HC2022. To be clear, Hindi box office collections weren’t in any form a reflection on the consumer. Hindi consumer has essentially been a very large outlier.
We have nearly doubled our holding within our theatrical exhibition holding over the last year, and it was our fourth biggest position at the end of March. Even excluding what we believe could be considerable extraction of synergies as the two largest players integrate, we see this position returning mid-20s or higher annualized over the next 3 years.
We have initiated 2 new exposures in our ‘tail’ in 2023 YTD. One is a Media name that we would prefer to not discuss publicly at this stage. The other is a fiberboard business, that manufactures a kind of board that is increasingly finding use in furniture within emerging markets12 . 3 large players currently control ~70% of the domestic capacity in this space. We understand that today it takes north of INR 25 billion (>$300 mil) to put up a capacity equivalent to 5% of industry’s C2022 ending domestic capacity. Expectedly then, this isn’t a very fragmented space with unorganized competition, and <10 manufacturers control the remaining ~30% of the capacity.
Currently, this business is selling domestically through 1,80013 dealers nationally, and domestic consumption is tracking about 10% steady growth (and our checks suggest no reason why this is going to materially decelerate anytime in the near future).
About a fifth of India’s current domestic consumption of this board is serviced through imports (which is higher vs. F2022, when container rates were extremely elevated, but lower vs. pre-pandemic levels). By our estimate, current inbound freight rates from the Far-East suggest that by the time product lands at Southern Indian ports, it’s about 15% dearer. We note that this is a highly automated space, and forestry access and efficiency at scale are therefore critical to be competitive across borders. Finally, our discussions with smaller contractors nationally suggested an unequivocal preference for the domestic product, with imports largely restricted to large volume buyers. Smaller local buyers, who make >2/3rd of the market, prefer domestic supplies because of their inability to invest in warehousing and because a vast majority of their order flow is immediate to short-term. The hypothesis that domestic capacity should be able to usurp share from imports isn’t a far-fetched one here. The two large known unknowns here are 1. Potential decline in prices, and 2. An
12 About 110 mil cubic meters of this board was sold globally in C2022, with barely 2.7-3 mil cubic meters sold in India. China accounts for about half of global consumption.
13 This base accounts for roughly 3/4th of industry-wide sales, suggesting a fairly reasonable upside from expanding distribution

uncertain global demand environment for fiberboard (particularly within offices). Let’s try addressing these in isolation:
Are potential price declines imminent? This exposure is essentially borne off of our disagreement on what appears an imminent contraction in pricing. The fear is rooted in a large domestic capacity buildup within this space over the next 2 years – Announced expansions will increase industry capacity by close to 50% within next 8 quarters. By our estimate, new lines break-even at 50-55% utilization levels, which should take 3-4 quarters, on average. While we agree that price contraction could take place, we believe that 1. It’s already priced in the stock, and 2. Historical price contraction is not extrapolatable at this time. With the context established, let’s look at 3 key facets related to historical price declines, current supply situation, and where India fits in:
- ✓ Fiberboard price for our new holding had declined by close to 10% in F2019 (Mar). It was evident however that they were priced about 10-11% (competitive capacity weighted) ahead of competition at the time, and accordingly had to rescale about as much in F2019 (Mar) as massive new industry capacity came online. We note that industry capacity is expanding by about 50% over a 2-yr period at this time. The corresponding increase between F2017-F2019 was nearly 160%.
- ✓ About half of all imported fiberboard consumed in India comes from Vietnam, which incidentally accounts for vast majority of Vietnam’s fiberboard exports. By our estimate, ~1.8 mil cbm of incremental capacity will come online in Vietnam between C2023 and C2024. However, more than 3/4th of that wouldn’t likely come online until next year.
- ✓ The most efficient Asian producers of fiberboard at scale expectedly focus on European markets. Consider this - The largest Thai manufacturer (controls about 30% of overall Thai capacity)14 derives nearly 85% of its revenues from exports, and India isn’t even mentioned as a destination within its top-11 export markets. While ASEAN players are certainly among the cheapest manufacturers of fiberboard, India certainly isn’t the easiest market to sell into.
Lot of moving parts make it extremely challenging to deduce potential end-market demand contraction at this time. Japan and Middle-East are the largest markets for Asian fiberboard exports, and account for nearly a fifth of fiberboard imports globally. Commercial real-estate markets in these geographies however aren’t exactly exhibiting similar trends – While Tokyo’s office vacancy rates are higher than what we saw getting into 200915, GCC markets seem fairly buoyant. Similar divergent trends are visible in NA and EU – While construction volume in EU is now where it used to be in the mid-90s, and 12-14% off of the financial crisis peak of late 2000s, office vacancy rates in San Francisco, New York, and Chicago are at record-highs.
We believe that the likely decline in prices is largely priced in the stock. Over the past year, this stock had halved. Globally, prices in this space form a bottom about 4 quarters ahead of trough margins, and this somewhat prompted our move at this time.
We don’t believe that price cuts could be any worse than what we witnessed in F2019. We note that getting into F2019 (Mar), the global market for fiberboard was fully supplied, with little slack capacity (primarily in
14 Its capacity is >60% of India’s industry-wide capacity
15 ASEAN fiberboard exports to Japan saw a mid-single-digit decline in C2009

Asia). Nonetheless, imports into India were down by almost a fifth in F2019 as domestic prices were cut between 4-11% (in INR terms). As we had mentioned earlier, the incremental domestic capacity build-up at that time was significantly sharper than what we see today.
When we evaluate efficient scale producers within India and the ASEAN pack (from Thailand, Malaysia, and Vietnam), we see about as much ‘idle + incoming’ capacity today (~400K cbm of idle + incoming capacity for the group in the below exhibit) as we saw getting into F2019 (Mar). Over this period however, global consumption for fiberboard has risen by ~10 million cubic meters. Further, when we analyzed current production cost curves at these efficient players, we observed that not only are contribution margins today slightly lower vs. what we saw getting into F2019 (Mar), but given today’s fixed cost structures, the differentials between prices and fixed costs for scale producers are also lower (see Exhibits 2a and 2b) – For efficient scale competition (all from ASEAN and India) charted below, we estimate that under an extreme case, prices today can be cut by 22.7%, vs. nearly 25% getting into F2019 (Mar).
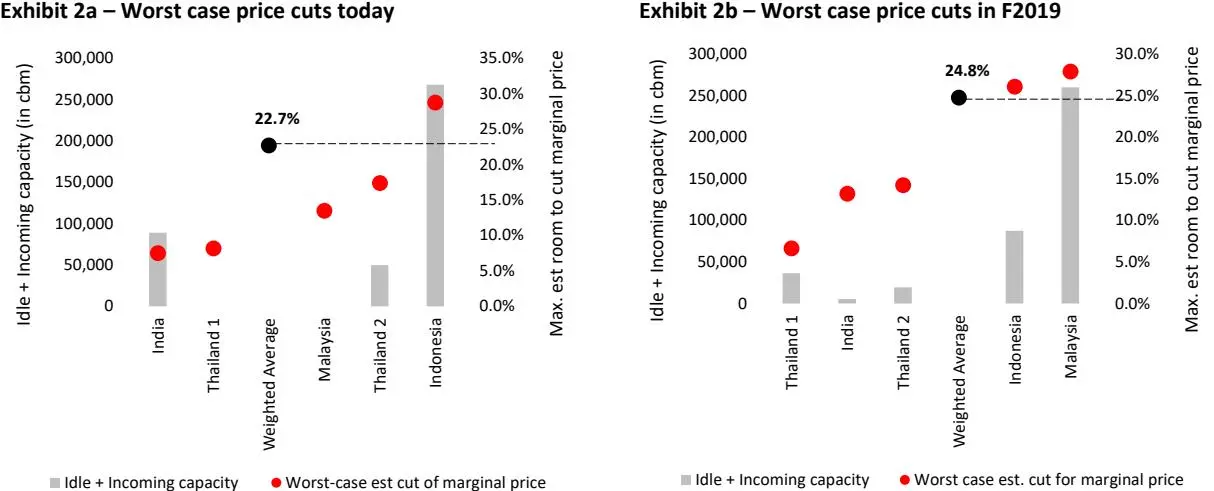
Notes: Contribution margins were estimated for listed Asian competitors and these were then scaled vs. our estimate of their current fixed costs. Worst case hypothesis assumes that prices can be lowered to a point where contribution margins can cover existing fixed costs. Source: Internal estimates; Company Reports
Consequently, it’s hard for us to build a likely case today for the kind of price cuts we saw in F2019 (Mar). Accordingly, we don’t see material room for incremental multiple contraction in a situation that we believe has ample tailwinds in the form of continued consumption growth for this kind of fiberboard (which we believe should be fully captured by us, in the absence of further multiple contraction).
Stay safe! Feel free to reach out if you have any questions. We are available 24/7 to address your concerns.
Thanks,
Piyush Sharma

Performance benchmarking
| Minerva India Under-served |
Nifty 50 | S&P BSE 500 | S&P BSE Midcap |
S&P BSE Smallcap |
Eurekahedge India |
India-focused CE Funds* |
|
|---|---|---|---|---|---|---|---|
| Trailing 1 year | 3% | 2% | -2% | 0% | -4% | -9% | -6% |
| Trailing 3 yr CAGR | 55% | 27% | 28% | 32% | 41% | 14% | 18% |
| Trailing 5 yr CAGR | 18% | 12% | 10% | 9% | 10% | 5% | 4% |
| Trailing 10 yr CAGR | 19% | 12% | 13% | 15% | 17% | 9% | 9% |
| Since inception CAGR | 17.2% | 10% | 10% | 11% | 9.8% | 7% | 8% |
| 2023 YTD | -6% | -5% | -6% | -5% | -7% | -3% | -2% |
| 2022 | 18% | 6% | 3% | 1% | -2% | -7% | -2% |
| 2021 | 92% | 23% | 30% | 39% | 63% | 25% | 20% |
| 2020 | 18% | 15% | 17% | 20% | 32% | 20% | 12% |
| 2019 | -10% | 12% | 8% | -3% | -7% | 1% | 3% |
| 2018 | -6% | 3% | -3% | -13% | -22% | -7% | -5% |
| 2017 | 17% | 29% | 36% | 48% | 60% | 29% | 31% |
| 2016 | 9% | 3% | 4% | 8% | 2% | 3% | 1% |
| 2015 | 22% | -4% | -1% | 7% | 7% | 6% | -1% |
| 2014 | 34% | 31% | 37% | 55% | 69% | 39% | 49% |
| 2013 | 21% | 7% | 3% | -6% | -11% | -6% | 6% |
| 2012 | 39% | 28% | 31% | 38% | 33% | 14% | 28% |
| 2011 | -11% | -25% | -27% | -34% | -43% | -25% | -31% |
| Annualized Volatility | 21.3% | 17% | 17% | 20% | 23.2% | 13% | 16% |
| Sharpe Ratio | 0.70 | 0.36 | 0.37 | 0.39 | 0.34 | 0.15 | 0.21 |
Source: BSE, NSE, EurekaHedge, Bloomberg
Note: Returns are until the end of March 2023; Our performance is net of execution charges and mgmt. fees, but before incentive fees; Our management fees are accrued monthly for reporting purposes. Since the fee is actually charged and calculated quarterly, compounding of the fee charge leads to us conservatively reporting slightly lower returns vs. client actuals; Sharpe was calculated by using since-inception monthly returns and is based on an Rf of 5%. Sortino was 0.98.
*US-based close-ended funds, with returns adjusted for INR/USD movements.
Strategy Snapshot
| Notes | |
|---|---|
| 62% | |
| $603 | >> Median holding’s market cap is $271 mil |
| 11.9% | >> Median institutional ownership of current holdings is 8.8% |
| 41% | |
| 86% | |
| 6.6x | >> vs. 15.2x (Nifty Smallcap 50), and 16.4x (Nifty 50) |
| 14 | |
Note: Characteristics are as at the end of March 2023

APRIL 2023 9
Meet your investment manager
Piyush Sharma, born and raised in India, has been running the Minerva India Under-served strategy across offshore and onshore structures since early 2011. The strategy focuses on investing in uncrowded and institutionally underowned/orphaned situations within Indian micro and smaller smallcaps. Essentially, strategy’s focus is on poor price discovery pockets. Having spent time with Citigroup and Bombay Stock Exchange in India, he moved to United States in early 2000s, where he covered stocks within Business Services, Autos, Consumer Products and Financials with Sanford Bernstein, Longbow Research, and Avondale Partners, working in teams that received accolades from leading institutional research arbiters, including Institutional Investor (II) and Greenwich Associates. Piyush received an MBA from University of North Carolina at Chapel Hill, MS from MNNIT, and BS in Accounting from University of Allahabad.

OFFERING DESCRIPTION: Minerva India Under-served is managed by Minerva Asset Advisors Pvt Ltd. It is offered on both onshore and offshore structures. Any reference to “Minerva” in this document refers to an investment offering managed by a regulated manager. The offering is only applicable for accredited investors.
DISCLAIMER: The information, opinions, estimates and projections contained in this newsletter were prepared by managers of Minerva India Underserved and constitute its current judgment as of the date of this note. The information contained herein is believed to be reliable and has been obtained from sources believed to be reliable, but we make no representation or warranty, either expressed or implied, as to the accuracy, completeness or reliability of such information. We do not undertake, and have no duty, to advise you as to any information that comes to our attention after the date of this fund brief or any changes in its opinion, estimates or projections. Prices and availability of securities are also subject to change without notice. This is not a prospectus and does not constitute investment advice or an offer or solicitation to buy or sell any designated investments discussed herein. Neither Minerva Asset Advisors, nor its officers, directors, agents, or employees make any warranty, express or implied, as to the suitability of any fund as an investment or of any kind whatsoever, or assumes any responsibility for, and none of these parties shall be liable for, any losses, damages, costs, or expenses, of any kind or description, arising out of this newsletter or your investment in any fund. You understand that you are solely responsible for reviewing any fund, its offering and any statements made by a fund or its manager and for performing such due diligence as you may deem appropriate, including consulting your own legal and tax advisers.
CONTACT US:
Piyush Sharma piyush.sharma@minervaassetadvisors.com Sourav Dutta sourav.dutta@minervaassetadvisors.com Shrey Gupta shrey.gupta@minervaassetadvisors.com Kunal Kapoor kunal.kapoor@minervaassetadvisors.com CS Raju raju.cs@righthorizons.com
+1-919-360-0359 [United States] +91-8007381793 [Gurgaon] +91-7982250326 [Kanpur] +91-9739010590 [Bangalore]