We can't find the internet
Attempting to reconnect
Something went wrong!
Hang in there while we get back on track

Dear Investors:
Next time you are peddled claptrap around how Indian headline large-caps are shimmering with ‘fairly valued quality’, remind yourself of that Alexandre Dumas quote - “All generalizations are dangerous, even this one”.
With due respect to India’s securities market regulator, it is better served lobbying for or creating an environment that improves price discovery vs. engaging in investment advisory services. Capital controls, inefficient and/or absent shorting ecosystems, under-institutionalization, overburdened judiciary that cannot swiftly clear securities-markets disputes within civil courts, elevated DIY investor activity, and poor financial literacy characterize security markets that are susceptible to frequent disconnects between underlying earnings and the ticker tape. Addressing some of these inefficiencies should be the regulator’s mandate. Nothing else! While it is undeniable that Indian headline smallcaps are richly valued, it is nonetheless naïve of SEBI to make sweeping statements on valuations. In our view, narratives that paint India’s headline large caps as “reasonably priced” are about as ingenuous as ones that postulate that all smallcaps are “extremely stretched”. We thoroughly disagree with narratives that suggest that domestic investors could do much better than low double-digits while investing within headline Nifty50 over the next 3-5 years. Such entitled claims brazenly disregard likely multiple contraction, adverse revisions, extraneous impact1 , growth deceleration, and/or capital outflows (all of which aren’t unlikely). As we see it, headline India today (across capitalizations) is priced to likely disappoint to different degrees. Nifty50 (ex-financials) ended March 2024 at 17.2x F2025E (Mar) EBITDA, or a low-teens premium vs. its pre-pandemic average. Notably though, these headlines are being capitalized upon an unequivocally sanguine median EBITDA growth estimate of +14% (translating into >20% earnings growth for the index), which we believe would likely be revised materially lower. Meanwhile, Minerva India Under-served ended March 2024 at around 9x F2025E (Mar) EBITDA, or about half of where India’s headline “reasonably priced” large-cap benchmark was trading.
Consistent with our prior experience within liquidity-driven rallies, we under-paced over the past year. In the 4 calendars (since our inception) that Nifty Smallcap50 returned >40%, we under-paced thrice. Over the past 12 months, Minerva India Under-served was up +26% (net; in INR), vs. +38% (gross; in INR) gain in BSE 500 and +60% (gross; in INR) gain in BSE Smallcap. Over the past 36 months, Minerva India Under-served was up +35% annualized (net; in INR), vs. +18% annualized (gross; in INR) gain in BSE 500 and +27% annualized (gross; in INR) gain in BSE Smallcap. Over 13 years of deployment, Minerva India Under-served is up +18% annualized (net; in INR terms), vs. +12% and +13% annualized gains (gross; in INR terms) in BSE 500 and BSE Smallcap respectively. Importantly, this decade-plus alpha wasn’t driven by skewed asset-class driven prints in 2014, 2017, 2021, or 2023. To see how our return streams capture alpha vs beta (often used by discerning allocators as a tool to identify performance repeatability2 , click here).
Only a fourth of our holdings gained in C1Q24. Our 2 biggest gainers were a media name (+43%), followed by our theme park holding (+18%). Our 2 biggest laggards in C1Q were a building materials name (-26%), which is our second smallest holding, and a spirits name (-24%), which is our 7th biggest holding. We finished March 2024 with 20% liquidity, which was our highest level in 9 years.
While the ticker tape gets increasingly fatigued, we note predictable attempts to justify certain exorbitant valuations. For instance, it’s grossly misleading to suggest that price growth in headline Indian midcap and smallcap names was driven by underlying earnings growth (as opposed to multiple expansion). Such

1 Getting into F2024 (Mar), >43% of BSE Sensex (ex-financials) revenues were generated outside India, significantly higher than ~34% getting into F2002 (Mar) and ~35% getting into F2009 (Mar).
2 BSE 500 was used as the benchmark

narratives are rooted in selectively picking above-par growth periods to make a flawed case for headline valuations being “reasonable” or “not overly stretched”.
Over the past 5 years (F2019-F2024E), multiple expansion for Nifty Smallcap50 and Nifty Midcap50 accounted for nearly 70% and nearly 60% of overall growth in enterprise values. In contrast, >60% of expansion in Minerva India Underserved’s enterprise values came from underlying earnings, even as there is a strong case to be made, be it on the back of improved operating returns3 or superior growth4 , for our book to structurally expand multiples. For more details on earnings growth vs multiple attribution for us and Indian benchmarks, click here.
Liquidity chased size within the “small” basket. Given our under-owned/orphaned positioning, our lags have typically always been prominent during periods of liquidity surges. Over the past year, we have come through a period when the vast majority of domestic investors chased just about anything that was labeled “small”. Hilariously though, given the impact cost considerations, most of this liquidity actually just ended up chasing names that are ‘small’ on mere optics. Essentially, headline ‘smallcap’ index components ended up handily outpacing those that weren’t part of such supposedly ‘smallcap’ benchmarks. While index inclusions/exclusions often drive security prices, the return differentials witnessed since the beginning of C2023 are staggering: >80% of all components that got included within Nifty Smallcap100 materially outpaced the index. Adverse impact as a result of exclusion was even starker, with double digit underpacing vs. the index.
India’s recent PMI readings notwithstanding5 , we continue to see deceleration in broader consumption trends. We would be remiss to ignore that >70% of all respondents on the most recent survey didn’t expect any growth over the next year. Further, despite re-emerged cost headwinds, >95% of all respondents couldn’t manage inflation pass-through in March.
We are increasingly noticing distress in rural and Tier-2 India, not that there was ever any significant revival here since the onset of the pandemic in early C2020. Tellingly, this is happening at a time when our labor contractor checks nationally are beginning to suggest somewhat fatigue in labor demand for construction activity (which incidentally was one of the biggest sources of jobs around the middle of last year)6 . Our observations on consumption trends sync with a weak hiring environment, particularly for the bottom half – While we have noted growth deceleration across the country over the past couple of quarters, it has been particularly pronounced in Tier-2/3 towns and rural India. The weakness since the beginning of the current calendar appears particularly sharp in such geographies, with quasi-discretionary categories (from rural/semiurban context) such as confectionary, personal care, and cigarettes showing distinct weakness. Further, after a somewhat improvement in downtrading in the second half of C2023, we are again seeing acceleration in downtrading across categories.
3 Our book’s cash operating returns have expanded nearly +300 bps vs. pre-pandemic, while Nifty50’s CFROIC has contracted nearly -50 bps over that period.
4 Over the past 5 years, median underlying earnings growth for our components was nearly twice that of headline mid and small caps (+15% median CAGR for us, vs. +9% for the benchmark components).
5 Read-through from India’s PMI readings has historically been treacherous. 2 of the best years (in terms of improved PMI prints vs. prior year) over the last decade were F2019 and F2022. Notably, the median BSE 500 manufacturing component reported +9% and +11% sub-par earnings growth respectively in the subsequent year.
6 On a national basis and across industry focus areas, our latest discussions with labor contractors suggest steady demand for labor though, which has been an unchanged trend over the last year. Construction labor demand however is now suggesting somewhat deceleration.

Valuations remain unequivocally stretched for headline names, while earnings growth cools off. At the end of March 2024, 55% of sub-industries7 within BSE 500 were trading at north of 6x book, with the median subindustry trading at 6.4x8 (see the right-most distribution chart in Exhibit 1). Unsurprisingly then, every 4th sub-industry within BSE 500 ended March 2024 higher than where it has ever traded since even prior to the 2008 meltdown. This is despite a significant decline in operating returns9 , and arguably potential growth for these components. In contrast, in such an unequivocally stretched valuation environment within Indian listed equities, Minerva India under-served finished March 2023 at 2.6x book10 (and not a single component exceeded 5.5x book).
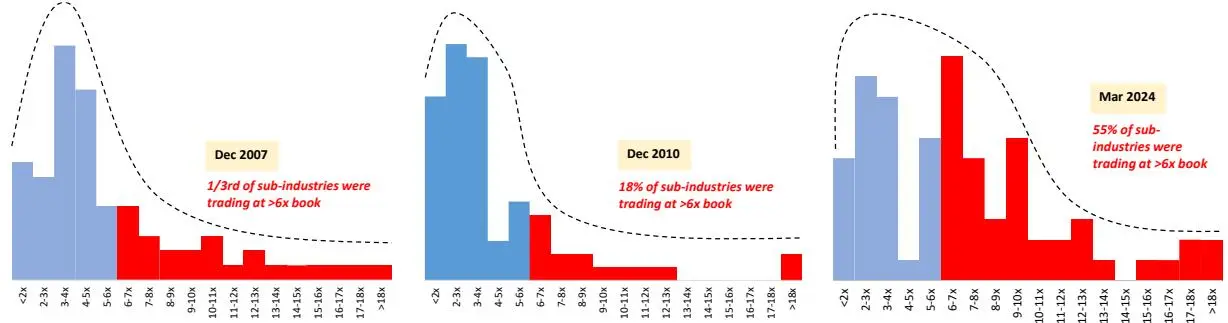

Notes: There are >70 sub-industries that comprised BSE 500 at the end of March 2024; To keep periods comparable and eliminate the issue around scarcity premium, we only included BSE 500 components that were public in Dec 2007. Sources: Ace Equity; Standard & Poor’s
Our attempt, as always, is to identify mispriced idiosyncrasies within Indian listed equities, which invariably are institutionally under-owned/orphaned. This ensures that we are nearly always positioned favorably to deliver superior, and more importantly largely disconnected, earnings growth, without the associated risks of structural multiple contraction12 .
For F2025E (Mar), we expect our book to report nearly +30% earnings growth. It’s essential to emphasize that these estimates are neither planked upon growth acceleration, nor material cost associated tailwinds. Further, these aren’t skewed because of certain components - About half of this growth is attributed to our top-5 holdings, which make about 55% of our book today. With 20% liquidity at hand, we are positioned nicely to aggressively engage as froth gives way to indiscriminate selling.
7 To keep this exercise comparable, we only included names that were public in 2007
8 That’s about 130% premium over where S&P 500 median P/B was at March end, and that was anything but a bargain. Relative to MSCI Emerging Markets peers, that was an even steeper 240% premium.
9 Median ROEs have steadily come off in India, from mid/high 20s in F2008, to low 20s in F2011, and to high-teens now.
10 Median for our book was 2.1x, vs. 5.8x for BSE 500 (ex-financials)
11 Nifty50 lost a fourth of its value in C2011 (which was also the year of our launch), while BSE Smallcap lost more than 40%
12 Minerva India Under-served ended March 2024 at a mid-teens discount vs. its pre-pandemic average of 10.6x EBITDA

Our exposure marginally declined in C1Q, going from 82% at the end of C4Q23 to an almost decade high 80% at the end of March. We fully exited a financials (non-bank) position (and don’t have any exposure to Financials now) and pared down an amusement park holding. This was partly offset by initiating a new exposure in an Apparel manufacturer.
We initiated a new exposure in an Apparel name – This isn’t the usual street hyperbole around India being a large beneficiary of de-risked supply chains. Instead, this is a bet on supply chain consolidation and build wherever its competitive (as opposed to ‘Make in India’). This was our first new exposure since beginning of C2023, making this our longest gap between initiating new exposures. We initiate this position at a time when inventory at fashion labels has been cut sharply over the past year – We note that the average C4Q23 revenues for PVH, Ralph Lauren, GAP, Nordstrom, and American Eagle were up by >30% vs. C1Q23, even as inventory was pared down by 10% over the same period. It wouldn’t be a stretch for us to claim that this is likely the most compelling value we see within global apparel manufacturing today. By the end of March, this new position made about 4% of our long book. Before we discuss the key tenets behind our thesis here, in order to draw the context, it is imperative that we briefly explain the 3 key industry shifts that are getting increasingly pervasive within global apparel manufacturing: diversification of footprint, consolidation of vendors, and increased sensitivity towards environmental and labor compliance.
- Geographical adaptability is increasingly critical; ‘Local for local’ approach favors more Asian footprint ahead. For most part of the last decade, apparel manufacturing continued to seek lowcost geographies, quicker production, and shorter lead times. As a result, footprints had been widening well beyond the likes of China, Bangladesh, Vietnam or India. For instance, the 300+ Chinese owned apparel factories in Myanmar today account for more than half of all apparel factories operating in the country. Similarly, in an attempt to address the near-shoring opportunity, our new holding ventured into a Central American country13 last year. It already had facilities in Bangladesh, and a couple of South East Asian locations. Further, with increased automation, which is inevitable, we expect this industry to gradually shift towards employing a ‘local-for-local’ sourcing approach within larger markets. Consequently, with Asian apparel sales growing at ~2x rest of the world14, it’s reasonable to expect Asian sourcing footprint to grow faster over the next 2 decades.
- Sourcing will likely consolidate from here. As fashion labels seek more agility from vendors, the focus would inevitably shift towards strengthening relationships with fewer vendors. Majority of fashion brands have already confirmed a cut in the number of contracted vendors, and both length and scope of vendor relationships are set to expand further. For context, H&M’s average relationship with its suppliers15 is about 7 years as-is. Essentially, we are entering a phase of expanded geographical footprint alongside fewer vendors.
- Social compliance getting more weight in supplier dashboards. Changing consumer behavior ensures that social compliance is increasingly becoming more critical in apparel manufacturing. Factors such as work conditions, environmental sensitivity, equitable compensation, tolerance etc are increasingly being used in supplier performance dashboards. We suspect (based on historical supplier assessments) that South Asia mostly trails in areas such as effective management of
13 About 55-hour drive to Long Beach, CA
14 China will likely surpass United States within next 5 years to become the biggest apparel market globally
15 ~13% of their product suppliers are based in India, while 22% are based in Bangladesh. Mainland China still accounts more than half of their global suppliers.

associated environmental risks. For instance, several large fashion buyers have pointed to Indian suppliers often being among the most exposed to water risks. Our new holding however rates favorably16 - Our holding’s South Asian facilities score in the 62-70 range, while its South East Asian facilities rate north of 80, vs. Apparel, footwear, and accessories global median score of 57.
EU and US apparel import volumes declined by more than 20% in C2023, hurting nearly all Indian apparel exporters. In contrast, our holding likely wrapped F2024E (Mar) with a +10% volume gain. We believe that this business has several idiosyncrasies that would propel cash flow growth at nearly 20% (our conservative base case) over the next two years. Our long thesis here is planked upon following 3 value drivers:
- 1. Expansion outside South Asia, and re-alignment within India would drive margin expansion. Within India, the company plans to move into central and eastern states where labor rates are lower and apparel companies are being offered subsidies to the tune of INR 3-6K per employee for a stipulated period, lowering labor costs by more than a third. Consequently, labor costs should come down to just around 9 per cent higher vs. Bangladesh’s new revised labor rates (INR 9.5K in Bangladesh, vs INR 10.4K in India post-subsidy). Further, benefits of 10-20% lower electricity charges, low interest rate loans, capital incentives, and higher subsidies for female workers (the primary worker base in most apparel plants) etc. would help lower domestic costs. We therefore expect India profitability to shift from a mid-single digit margin to low double-digits over the next two years, which would align it with Bangladesh’s current profitability. They recently expanded their capacity in a South East Asian market by 35%, which has historically operated at double digit margins with a focus on higher value-added apparel. While near-term margin slipped into single digits, higher pricing at this facility ($15-20 per piece) combined with higher profitability should help overall margins recover as volumes scale up. Overall, we expect to see this business scaling into double digit margin within the next two years.
- 2. Significant cut in the cash cycle. Cash cycle has been cut significantly through a combination of efficient collection and receivables factoring. Accordingly, core working capital has declined from 18% of revenues in the pre-pandemic period to a sharply lower 10% today. That said, there has been a recent temporary logistical setback - Rounding Africa sails continue to be a bottleneck for global maritime trade. Shipments from this holding’s Indian and Bangladeshi facilities experienced a week’s delay due to Houthi rebel attacks in the Red Sea. However, shipments from our holding’s SE Asian facilities aren’t impacted since they use the trans-pacific route.
- 3. Ongoing favorable mix-shift in South East Asia is a material optionality. Pricing has grown at a 10% annualized rate over the last four years, principally due to a product mix shift. Both South East Asian facilities have historically had double-digit margins, and materially higher per-piece pricing ($15-30). We expect higher utilization at these facilities17 in these premium garment manufacturing areas to asymmetrically impact the bottom-line. Our current estimates conservatively assume flattish pricing trend over the next two years.
This new position of ours began C2Q24 trading at 6.5x F2025E (Mar) EBITDA, and 7.3x F2025E (Mar) Ind-AS 11618 adjusted EBITDA, with the latter being about 25% below pre-pandemic average. Between underlying earnings and re-rating, we expect this name to more than double within the next 2 years.
16 Prominent index used for this purpose is the Higg’s Index FEM score, launched by Sustainable Apparel Coalition. Used by some of the largest retail brands to evaluate suppliers, the scoring mechanism rates every garment manufacturing unit on multiple ESG parameters.
17 We estimate that just about half of these capacities were utilized in F2024 (Mar)
18 Excluding the impact of Indian Accounting Standard 116 on ‘Leases’, to allow for pre-pandemic comparisons

Forestry’s whodunnit! Bizarre multiple contraction at our forestry holding (despite favorable pricing environment) creates record discounts vs. global forestry peers. Our forestry holding lost more than a fifth of its value in C1Q24, and was down more than 30% from its peak by the end of March 2024. Bizarrely, this comes despite earnings upgrades, and when its valuation discount vs global forestry peers is higher than we have ever seen in >12 years of holding this name.
Prompted somewhat by transport strike in Finland19, BEK prices had increased another $80/ton in the US in early March, while Suzano had again set up $30-$80/ton hikes for March in Europe, NA, and Asia. As we write this quarter-end letter, we note that Suzano and Arauco have set up another $30-$100/ton BEK increase for April, breaching the $700/ton mark in China. BEK demand meanwhile remains fairly robust20 . As things stand, it’s not a stretch to expect BEK prices to remain comfortably north of $650/ton (CIF, China) over the next couple of years (with fiber shortage likely driving it further higher), which will still be significantly off of the ~$850/ton (CIF, China) levels in mid-2022, but sharply above the ~$450/ton lows of a year ago. Aided by what we believe would be a stable BEK price environment, we now expect to see solid pricing for our forestry holding, particularly within uncoated cut-size grades21, which makes nearly half of our holding’s operating earnings, and tends to exhibit far more stable pricing (to better appreciate why the read-through from global BEK pulp pricing volatility to domestic uncoated cut-size pricing is trivial, please refer to our July 2023 investor letter). To support our favorable view on BEK, we would accentuate the following:
- 1. Global pulp inventories were below 5-yr averages at the beginning of the current calendar. Stocks at manufacturers and ports were elevated in the first half of C2023, before normalizing in the second half, and eventually ending below 5-yr average by the end of the calendar. Inventory fell 7% at manufacturers and 6% at ports in 2HC2023, with stocks at ports dropping sharply by 11% in China and 35% in Europe.
- 2. From C2H24 onwards, no BEK pulp capacity is coming online until C2028E. Despite continued increases in pulp prices over the last few quarters, world’s most efficient producer of BEK noted the following at the end of February: “It’s very difficult to justify new projects at this point of time. When somebody will start a new construction, this is going to take at least 30-32 months, and we are not seeing new projects coming for commissioning in the next 3 years”. Unsurprisingly, over the past 3 quarters, C2025E and C2026E earnings expectations for this producer have been revised upwards by +100% and +20% respectively. We are now getting into one of the longest pause periods of capacity addition. After Cerrado’s launch in mid-202422 , which would lead to a mid-single digit increase in global hardwood pulp capacity, there is no pulp capacity coming online until C2028E (see Exhibit 2).
- 3. Differential between Chinese BEK prices and the landed price in China (for the most competitive BEK producer in Latin America) are close to historical average. China BEK prices declined nearly 25% in C2023, but differential between landed cost in China (of LatAm BEK pulp) and Chinese prices is now near historical average, which should provide support to the current run-up in global prices (see Exhibit 3 on next page).
19 The Finnish Transport Union announced a 2-week strike at ports (beginning 11th March)
20 As per Brazil’s Secretariat of Foreign Trade, BEK export volume was up nearly +4% in February
21 By our estimate, domestic uncoated cut-size prices were up +7% sequentially in C1Q24
22 Between Arauco, and UPM, ~3.7 mil tons of BEK capacity got launched last year, and Suzano, would bring in ~2.5 mil tons of BEK capacity online in 1H2024

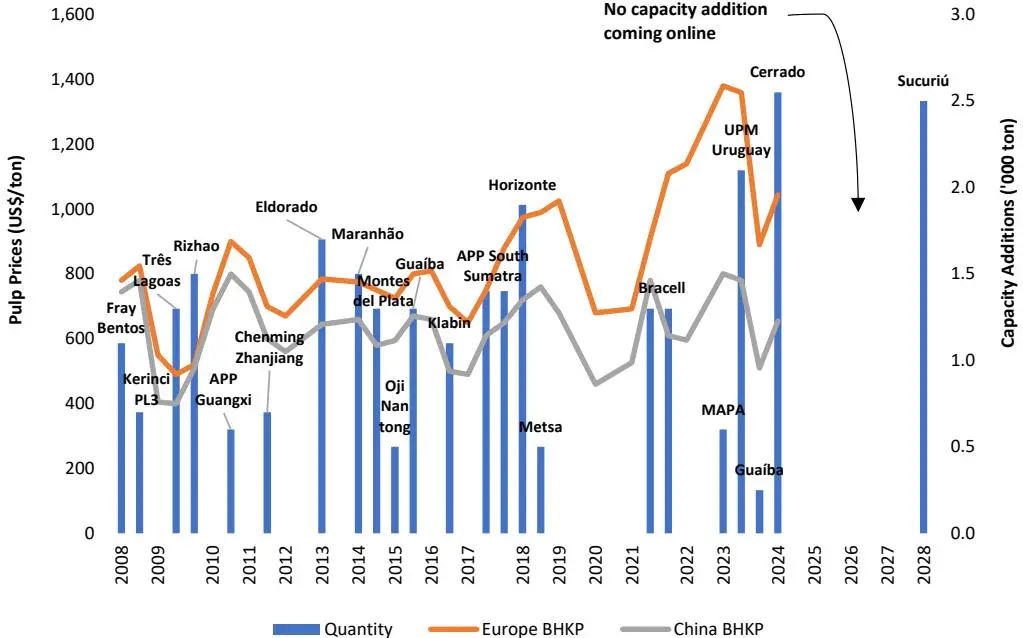
Exhibit 2 – Global BHKP capacity additions and pipeline vs. Europe and China BHKP prices
Notes: APP Sumatra was partially integrated production. MAPA is gross capacity, does not consider the closure of Line 1 in Horcones plant. For Bracell, paper grade volumes are uncertain.
Sources: Hawkins Wright, Pöyry and Suzano; PIX China List Price until April 2017 and PIX China Net Price afterwards
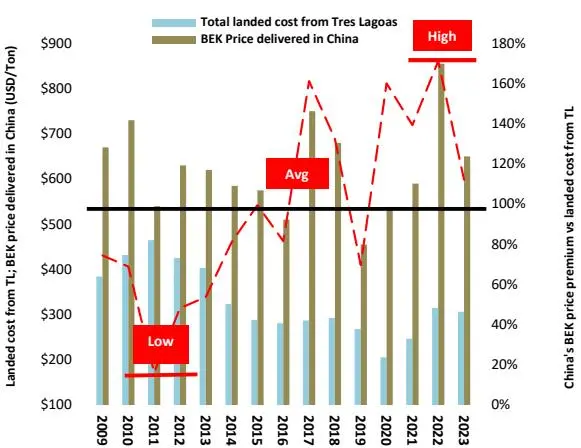
Exhibit 3 – China’s price premium vs. landed cost from TL
Notes: Transportation cost is calculated from Tres Lagoas (Sao Paulo), Brazil, to the port of Shanghai. Truck was assumed as the preferred mode from Tres Lagaos to the port of Santos, which is about 750 kms away. More than 60% of China’s BEK demand is serviced by Latin America.
Sources: S&P Global Market Intelligence; Company Reports, RISI, USDA, Instituto Brasileiro de Geografia e Estatistica
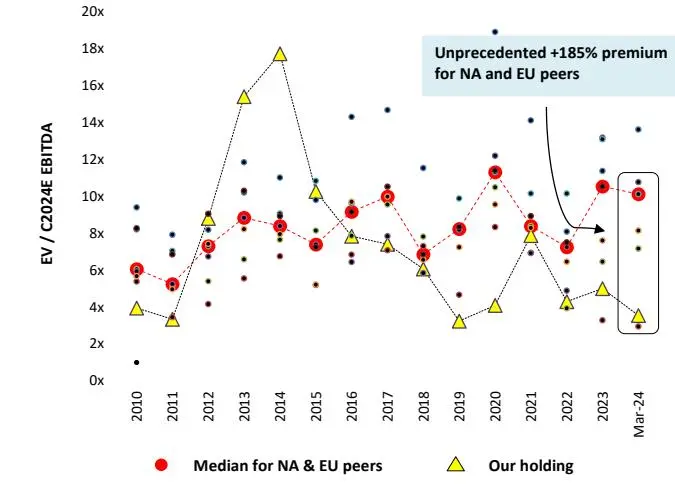
This is arguably the most attractive forestry long in a global forestry pair trade today. Since May of last year, BEK prices in China have risen by ~45%, expectedly driving forestry stocks globally by about 25% (see Exhibit 4). Over this period, our holding bizarrely traded down and ended March trading at an unprecedented discount to its European and North American peers (see Exhibit 5). We suspect that this was driven by fears around domestic fiber shortage, which we note fail to appreciate its inevitable abatement - We note that agroforestry sapling plantations have grown by nearly +50% since F2021 (Mar), significantly reversing a decline of -23% in the prior 5-year period. By our estimate, given the breakdown of area under plantation23, weighted average plantation cycle for our holding is little over 3 years, suggesting that F2025E (Mar) wood supply nationally should be ~20% higher, with similar increase likely in F2026E (Mar) as well.
As a result of price divergence over the last year, this name now trades at an unprecedented discount vs.
23 Sourcing for our holding’s flagship mill in Eastern India is as follows: eucalyptus (55%), casuarina (25%), and subabul (20%). In contrast, subabul accounts for ~70% of sourcing for our holding’s mill in Western India.

its EU and NA peers. The only other time when our holding traded lower despite a sharp increase in BEK prices was during the Dec 2011 – Mar 2013 run-up (see Exhibit 4). This was on the back of significant capacity ramp-up at our holding (+70%), with 15% of the then INR 16.5 Bil expansion budget financed by new stock issuance and another 13% from Euro-denominated convertible issuance. Further, elevated energy and material costs were incremental headwinds. Our holding however is getting into F2025E (Mar) in an entirely different environment:
- ✓ Coal and caustic soda prices24 are expected to decline or remain flattish this year, while pulp prices will likely be supportive.
- ✓ Import intensity will likely remain low in the first half because BIS license for importers is pending renewal and likely wouldn’t happen until the second half of the current calendar.
- ✓ By our estimate, this holding of ours should conservatively report >INR 11 Bil in free cash flow in F2025E (Mar), or >INR 10 Bil after dividends25. It would be more than reasonable to assume that most of the INR 10+ Bil in net debt would come off the books in this fiscal.
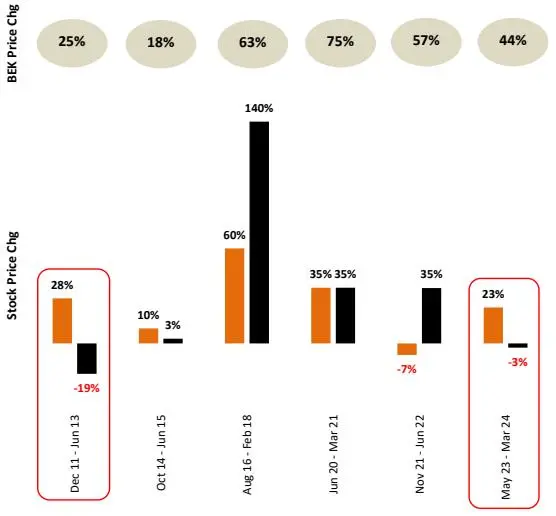
Exhibit 4 – Stock price changes during BEK price up-moves Exhibit 5 – Valuation premium/discount for NA and EU peers
Median [NA & EU] Our Holding
Notes: Exhibit 5 charts EV / C2024E EBITDA for North American and European forestry (integrated ops) peers; All BEK price changes are based off of China CIF USD prices.
Sources: S&P Global Market Intelligence; Company Reports; FastMarkets
What happens in the unlikely scenario of BEK prices reversing?. In the subsequent 12 months succeeding 2 of the 3 prior BEK peaks, EBITDA expanded for our forestry holding. The lone exception was the March 2011 BEK peak – In F2012 (Mar), our holding battled higher material, chemical, and energy costs - Elevated material and chemicals26 costs accounted for >600 bps adverse impact, and lower access to linkage coal27 accounted for 275 bps adverse impact on margins.
24 Energy (20-25% of input cost), and chemicals (15-20% of input costs) are critical inputs
25 At F2024E (Mar) dividend payout run-rate
26 Caustic soda prices rose ~50% in F2012 (Mar)
27 On April 3, 2012, GOI issued a Presidential directive to CIL to sign FSAs with power producers in which CIL was required to assure at least 80% of the committed coal delivery with a penalty clause on shortfall of supply.

With no incremental productivity shifts baked in (even as they are now routine for this holding), no abatement in import intensity for paper board, continued shortage of domestic fiber (and therefore continued higher prices), we are still unable to come up with anything under mid-teens earnings growth in F2025E (Mar) for this name. Given that even such reasonable estimates are capitalized at record discounts vs. EU and NA peers, we view this position as the most attractive ‘long’ for constructing one of the most attractive pair trades available today.
In summary, we struggle to reconcile our holding’s underlying fundamentals with its sharp divergence vs. global forestry stocks. In absolute terms, we conservatively expect a +70% re-rating ahead of where it ended C1Q24. Coupled with even conservative expectations around underlying growth, we therefore accord this holding more than an even chance to at least double from here within the next 2 years, which would still not be enough to bring its discount vs global peers to historical averages.
Idiosyncrasies to drive earnings growth for our auto parts names, despite what we believe would be a subconsensus year for Indian vehicle sales. In case of two-wheelers, we note that 1. inventory built up nearly across OEMs over the course of F2024 (Mar), 2. there is a >15% decline in the number of marriage days in the Hindu calendar for F2025E (Mar), and 3. exports remain muted, amid growing distress for the domestic bottom half. Unless Indian monsoons spring a material upside surprise here, we don’t expect launch and facelift calendar to offset likely demand headwinds in the current fiscal. As we write this quarter-end letter though, street estimates expect India’s biggest two-wheeler OEM to show +14% revenue growth in F2025E (Mar), vs. +11% in F2024E (Mar), principally on the back of increased positioning away from the distressed bottom half. Contrast this with our second biggest auto parts holding, which supplies into this two-wheeler market – F2025E (Mar) revenues are expected to conservatively grow +12%, despite a more favorable domestic OEM alignment28 , further traction in exports off of a low base29 , and continued secular shift from halogen to LEDs30. These relatively grounded expectations today are then capitalized at 8.8x F2025E (Mar) EBITDA, implying near 50% premium for the above-mentioned OEM. This is just another illustration of our continued positioning to stay away from ‘well-priced’ growth.
Just as in the case of two wheelers, with the exception of certain European OEMs such as Skoda Volkwagen, Renault etc., we also see somewhat elevated inventory in most passenger vehicle dealer channels. However, despite the inventory overhang at dealers, our biggest auto parts holding would be comping easier bases in several key parts of their business, and we therefore expect a significantly industry-decoupled performance in F2025E (Mar). In particular, we would point out the following:
- 1. Release of certain high volume and low-growth models had dragged headline revenue growth in F2024 (Mar). Towards the end of F2023 (Mar), our holding had released two legacy models31 contracts at Maruti Suzuki32, which were collectively contributing about a million rims annually, or ~15% of this holding’s domestic PV steel rims sold in F2023, even as EBITDA contribution on these 28 Getting into F2025E, our holding had insignificant exposure to domestic ‘mass OEMs’ (Hero Motocorp and Bajaj Auto), but would gain incremental share at Hero Motocorp, after being selected as the exclusive supplier to 2 new models in F2025E. Further, unlike the mass OEMs that have been laggards within EVs, our holding is well represented here, with nearly 6% of their revenues in F3Q24 (Dec) coming from EVs. 29 Just over 1% of F2024E revenues likely came from exports
30 India’s two biggest 2W OEMs today have 4x as many ‘all-LED’ two-wheeler models as they had barely 4 years ago
31 Our holding was servicing about 70% of these models’ volumes.
32 Serviced from our holding’s plant in Punjab. Utilization had declined ~600 bps as a result of this.

models was insignificant. Adjusted for this give-away, a 13% headline volume decline for PV domestic steel rims over the first 3-quarters of F2024 would have been low single-digit growth.
- 2. Favorable domestic OEM alignment for alloy growth. Our holding is relatively more aligned with domestic alloy growth vs. steel. With the exception of Maruti Suzuki (where they currently have no penetration in alloys), they hold significantly higher share within alloy usage elsewhere vs. steel. Given the launch calendar of F2025E (Mar) and current dealership inventory, we expect key alloy customers such as Hyundai, Kia, and Honda to gain unit share in this fiscal, while India’s largest OEM will likely lag. Incrementally, we note significant revenue accretion from 2 model refreshments at Tata Motors33 (50% share) and a model addition from M&M. Accordingly, a +3% increase in domestic car sales for F2025E should likely translate into low-mid teens PV revenue34 growth at our holding. This does not include potential alloy wins at Maruti Suzuki in the latter half of the fiscal.
- 3. Exports are likely to continue their revival; Alloy exports expected to double off of a low base. We note that in C2024, trailer and motorhome sales in US would face the easiest comparisons35 over the last decade. Nonetheless, F2025E (Mar) exports growth here isn’t being driven by this end-market. Instead, it’s almost entirely driven by wins at agri-equipment OEMs. For F2025E (Mar), this business should generate INR 6.8-7 Bil in export revenues, or +12% growth. This would still be ~20% below F2022 (Mar) levels. Further, alloy rim revenues from exports to high-speed trailers should continue to grow from its low base of under INR 850 Mil in F2024 (Mar) to nearly INR 1.6 Bil in this fiscal.
- 4. Share gains across CVs and Tractors have been reported (offsetting muted OEM growth); Aluminum steering knuckles should contribute about INR 250-300 mil this year. Domestic steel revenues (ex-PVs) will likely show low single digit decline, with 7-8% industry-wide decline getting largely offset by several wins at Swaraj Mazda, Daimler, Ashok Leyland, Volvo, Escorts, and TAFE. On the steering knuckles side, INR 250-300 mil should get booked in this fiscal (from initial supplies to M&M by mid-F2025*,* followed by supplies to Tata Motors), and likely double this in F2026E (Mar).
If PV sales were to underwhelm with low-single digit growth, we expect this position to still deliver high single-digit revenue growth, which should translate into EBITDA growth in the low-20s as domestic alloys and exports gain share within a more favorable mix. On these very realizable estimates, this position is now priced at <7.5x F2025E (Mar) EBITDA, or nearly 25% discount to pre-pandemic averages.
De-cartonization within domestic spirits is now behind our biggest packaging holding. To offset sharp increase in paperboard prices, likes of Pernod Ricard and Diageo took paperboard out of SKUs at the lower end of the premium spirits category. This made about 10% of our holding’s business in F2023 vs. low singledigit contribution now. Adjusted for ‘de-cartonization’ within spirits, EBITDA growth in F2024E (Mar) would have been in the low-mid teens vs. the mid-single digit headline growth they would likely report. Elsewhere, for F2025E (Mar), we expect exports, off of a low base, to continue to do well for both FBB (primarily for food and tobacco brands) and flexible packaging pieces of this holding. Despite easier comparison, for F2025E (Mar), this holding is now priced at 9.5x our conservative low double-digit EBITDA growth estimate, which is a considerable deceleration vs. the mid-high teens growth we have been accustomed to.
33 Beginning around the end of F2Q25 (Sept); all alloys
34 Domestic PV revenues likely accounted for >40% of our holding’s revenues in the last fiscal. For F2025E (Mar), we are expecting alloy penetration to increase by 2-3% at all OEMs (with no change at Maruti Suzuki)
35 >35% decline in C2023

Domestic box office collections were muted in the first calendar quarter; ‘Dune: Part Two’ global collections were another indicator of how viewers are increasingly seeking premium content. Overall, Indian domestic box office collections were flattish in C1Q, with solid growth in Telugu and Malayalam content offsetting sharp declines in English, Kannada, and Tamil collections. We note that the impact of the Hollywood strike was particularly concentrated in the March quarter, with English collections declining 50% vs. C1Q23, and accounted for <5% of domestic collections vs. >10% in the first 3 months of the fiscal. Critically, we note several tentpoles getting pushed into C2025 release calendar, likely driving significantly better collections in C2025 and C2026. That said, IMAX offtake in C1Q continued to be impressive globally - Following Oppenheimer’s success36 last year, IMAX’s growing penetration within tentpole releases continued in C1Q24 - About a fifth of ‘Dune: Part Two’ global ticket revenues came from IMAX screens37, with several instances of ‘3 PM’ shows.
Screen count for our theatrical exhibition holding is expected to see a high single-digit increase in F2025E (Mar), with faster growth in high occupancy Southern Indian geographies38 . Further, tougher comparisons for Hollywood releases in the first half of the fiscal should get more than offset by easier comparisons in the second half. Lastly, continued growth in premium formats39 and concessions spending40 should combine to support what appears to be a fairly reasonable mid-teens revenue growth estimate for F2025E (Mar). That should translate into a mid-20s growth in EBITDA, pricing the enterprise at about 8.5x F2025E (Mar) EBITDA, or equity at about 11x F2025E (Mar) FCF. Even with considerably shaved down expectations, we would be disappointed if we don’t double our capital here within the next 3 years.
We fully exited our smallest position in a rural/semi-urban lender in February. We had exited a vast majority of this holding a few years ago. Even though credit costs had come off slightly in the recent past, operating returns not only remained depressed, but we also didn’t see any clear catalyst to improve these materially. While historically 2x F2024E (Mar) book was somewhat justifiable given the runway of growth in rural and semi-urban markets, high single digit book growth now didn’t make this a compelling hold at a time when we only wanted distinct unqualified value in our books.
Please let us know if you have any questions/concerns.
Thanks,
Piyush Sharma
Minerva India Under-served
Minerva Asset Advisors Pvt Ltd. Tower B, 10th Floor, Unitech Cyber Park, Sector 39, Gurugram, Haryana 122003, India
37 IMAX screens make less than 1% of global theatrical screens
36 While IMAX format screenings made about a fifth of Oppenheimer’s global box office, the corresponding contribution of IMAX screenings in India was INR 500 mil, or >30% of Oppenheimer’s domestic box office revenues (despite relatively lower IMAX penetration in India)..
38 As a result of considerably lower supply, multiplex screen occupancies in Southern India typically run nearly 50% higher vs. Western India. While contribution from concessions is a bit lower in South, Southern screens still typically report 5-10% higher margins vs. our holding’s rest of India screen network, with payback periods often being half of what we have seen in Western India.
39 Average ticket pricing increased in the low-teens in the first 3 quarters of F2024 (Mar)
40 Concessions spend per head saw a +11% increase in the first 3 quarters of F2024 (Mar)

Performance benchmarking
| Minerva India Under-served |
Nifty 50 | S&P BSE 500 | S&P BSE Midcap |
S&P BSE Smallcap |
Eurekahedge India |
India-focused CE Funds* |
|
|---|---|---|---|---|---|---|---|
| Trailing 1 year | 27% | 35% | 38% | 63% | 60% | 29% | 37% |
| Trailing 3 yr CAGR | 36% | 17% | 18% | 25% | 28% | 11% | 11% |
| Since inception CAGR | 18% | 11% | 12% | 14% | 13% | 8% | 9% |
| 2024 YTD | -6% | 5% | 4% | 7% | 1% | 4% | 7% |
| 2023 | 28% | 22% | 25% | 46% | 48% | 20% | 26% |
| 2022 | 18% | 6% | 3% | 1% | -2% | -7% | -2% |
| 2021 | 92% | 23% | 30% | 39% | 63% | 25% | 20% |
| 2020 | 18% | 15% | 17% | 20% | 32% | 20% | 12% |
| 2019 | -10% | 12% | 8% | -3% | -7% | 1% | 3% |
| 2018 | -6% | 3% | -3% | -13% | -22% | -7% | -5% |
| 2017 | 17% | 29% | 36% | 48% | 60% | 29% | 31% |
| 2016 | 9% | 3% | 4% | 8% | 2% | 3% | 1% |
| 2015 | 22% | -4% | -1% | 7% | 7% | 6% | -1% |
| 2014 | 34% | 31% | 37% | 55% | 69% | 39% | 49% |
| 2013 | 21% | 7% | 3% | -6% | -11% | -6% | 6% |
| 2012 | 39% | 28% | 31% | 38% | 33% | 14% | 28% |
| 2011 | -11% | -25% | -27% | -34% | -43% | -25% | -31% |
| Annualized Volatility | 21% | 17% | 17% | 20% | 23% | 12% | 16% |
| Annualized Volatility (+ve) | 14% | 11% | 11% | 12% | 13% | 7% | 9% |
| Annualized Volatility (-ve) | 15% | 12% | 12% | 15% | 17% | 9% | 12% |
| Sharpe Ratio | 0.74 | 0.48 | 0.49 | 0.57 | 0.48 | 0.28 | 0.34 |
Source: BSE, NSE, EurekaHedge, Bloomberg
Note: Returns are until the end of March 2024; Our performance is net of execution charges and mgmt. fees, but before incentive fees; Our management fees are accrued monthly for reporting purposes. Since the fee is actually charged and calculated quarterly, compounding of the fee charge leads to us conservatively reporting slightly lower returns vs. client actuals; Sharpe was calculated by using since-inception monthly returns and is based on an Rf of 5%. Sortino was 1.1.
*US-based close-ended funds, with returns adjusted for INR/USD movements.
Strategy Snapshot
| Characteristic | Notes | ||||
|---|---|---|---|---|---|
| Top 5 positions as % of book | 54% | ||||
| Avg. weighted market cap of book (mil) | $531 | >> Median holding’s market cap is $360 mil | |||
| Avg. weighted institutional ownership | 13% | >> Median institutional ownership of current holdings is 11% | |||
| Avg. weighted free float of book | 39% | >> Median free float is 42% | |||
| Net Exposure | 80% | ||||
| Avg. weighted F2025E (Mar) EV/EBITDA | 9.1x | >> vs. 20.2x (Nifty Smallcap 50), and 17.2x (Nifty 50) | |||
| Avg. weighted current P/B | 2.6x | >> Median P/B was 2.1x | |||
| # of positions | 13 |
Note: Characteristics are as at the end of March 2024

APRIL 2024 13
Meet your investment manager
Piyush Sharma, born and raised in India, has been running the Minerva India Under-served strategy across offshore and onshore structures since early 2011. The strategy focuses on investing in uncrowded and institutionally underowned/orphaned situations within Indian smaller smallcaps. Essentially, strategy’s focus is to capitalize upon flawed overly-generalized narratives within poor price discovery pockets. Having spent time with Citigroup and Bombay Stock Exchange in India, he moved to United States in early 2000s, where he covered stocks within Business Services, Autos, Consumer Products and Financials with Sanford Bernstein, Longbow Research, and Avondale Partners, working in teams that received accolades from leading institutional research arbiters, including Institutional Investor (II) and Greenwich Associates. Piyush received an MBA from University of North Carolina at Chapel Hill, MS from MNNIT, and BS in Accounting from University of Allahabad.

OFFERING DESCRIPTION: Minerva India Under-served is managed by Minerva Asset Advisors Pvt Ltd. It is offered on both onshore and offshore structures. Any reference to “Minerva” in this document refers to an investment offering managed by a regulated manager. The offering is only applicable for accredited investors.
DISCLAIMER: The information, opinions, estimates and projections contained in this newsletter were prepared by managers of Minerva India Underserved and constitute its current judgment as of the date of this note. The information contained herein is believed to be reliable and has been obtained from sources believed to be reliable, but we make no representation or warranty, either expressed or implied, as to the accuracy, completeness or reliability of such information. We do not undertake, and have no duty, to advise you as to any information that comes to our attention after the date of this fund brief or any changes in its opinion, estimates or projections. Prices and availability of securities are also subject to change without notice. This is not a prospectus and does not constitute investment advice or an offer or solicitation to buy or sell any designated investments discussed herein. Neither Minerva Asset Advisors, nor its officers, directors, agents, or employees make any warranty, express or implied, as to the suitability of any fund as an investment or of any kind whatsoever, or assumes any responsibility for, and none of these parties shall be liable for, any losses, damages, costs, or expenses, of any kind or description, arising out of this newsletter or your investment in any fund. You understand that you are solely responsible for reviewing any fund, its offering and any statements made by a fund or its manager and for performing such due diligence as you may deem appropriate, including consulting your own legal and tax advisers.
CONTACT US:
Piyush Sharma piyush.sharma@minervaassetadvisors.com Arpit Khunteta arpit.khunteta@minervaassetadvisors.com Sourav Dutta sourav.dutta@minervaassetadvisors.com Kunal Kapoor kunal.kapoor@minervaassetadvisors.com Siddhant Chhabra siddhant.chhabra@minervaassetadvisors.com CS Raju raju.cs@righthorizons.com
Minerva Asset Advisors Pvt Ltd. Tower B, 10th Floor, Unitech Cyber Park, Sector 39, Gurugram, Haryana 122003, India
+1-919-360-0359 [United States] +91-9910944277 [Gurgaon] +91-9739010590 [Bangalore]